

Data-driven graphics in TikZ/LaTeX
16 Feb 2021
*UPDATE 2021-06: After testing this workflow and running into its limitations I went further with a system that can handle larger graphics more robustly. See here for details: Data-driven graphics in D3.js (not TikZ) for LaTeX.*
I’m working on a thing that involves going through a lot of research papers and sorting and categorizing them based on certain features of the projects they describe. In this kind of work, it is often very useful to be able to present the found information (and lack of information) in a glanceable manner. It can lead to new insights for the reader even without them having to spend hours looking up and understanding all the catalogued material.
This lead me to look for ways of doing data-driven graphics in a way that can easily be deeply embedded in a LaTeX document. In some other project I might prefer to do this kind of thing using e.g. D3.js or Bokeh, but in this case embedding non-LaTeX graphics would lead to inconsistent style and losing clickable reference links. Thus, TikZ seemed like the most effective and comprehensive drawing library available.
TikZ (and LaTeX in general) are by far not my favorite programming environment and syntax. Even if you buy into the idea of programming to create documents, all the backslashes and curly braces and the lack of best practices and poor debuggability are headache-inducing.
Regardless, LaTeX and TikZ aren’t impossible to use, and TikZ is quite straightforward to get started with. It provides quite advanced drawing features as well, such as SVG-like clipping paths and gradients.
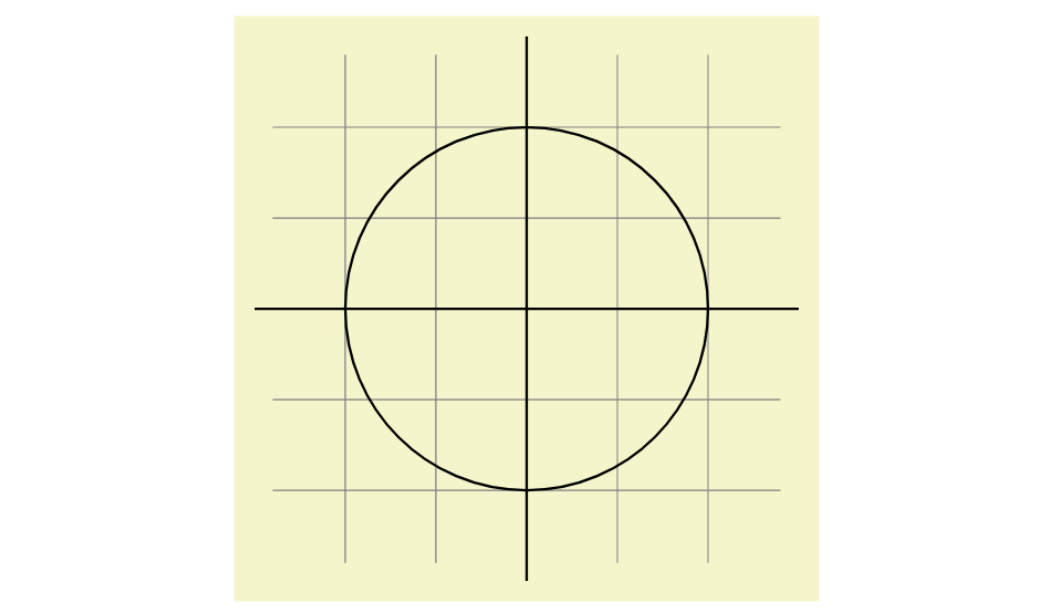
A simple program that draws a grid and a circle might look like this:
\begin{tikzpicture}
  \draw[step=.5cm,gray,very thin] (-1.4,-1.4) grid (1.4,1.4);
  \draw(-1.5,0) -- (1.5,0);
  \draw(0,-1.5) -- (0,1.5);
  \draw(0,0)circle[radius=1cm];
\end{tikzpicture}
… to produce this:
I found the manual very helpful for both introductory guides and deeper information. Actually, the above program is stolen from there. The manual is an absolutely gigantic tome, but you don’t need to read much of it to get started. I recommend starting from Part I: Tutorials and Guidelines.
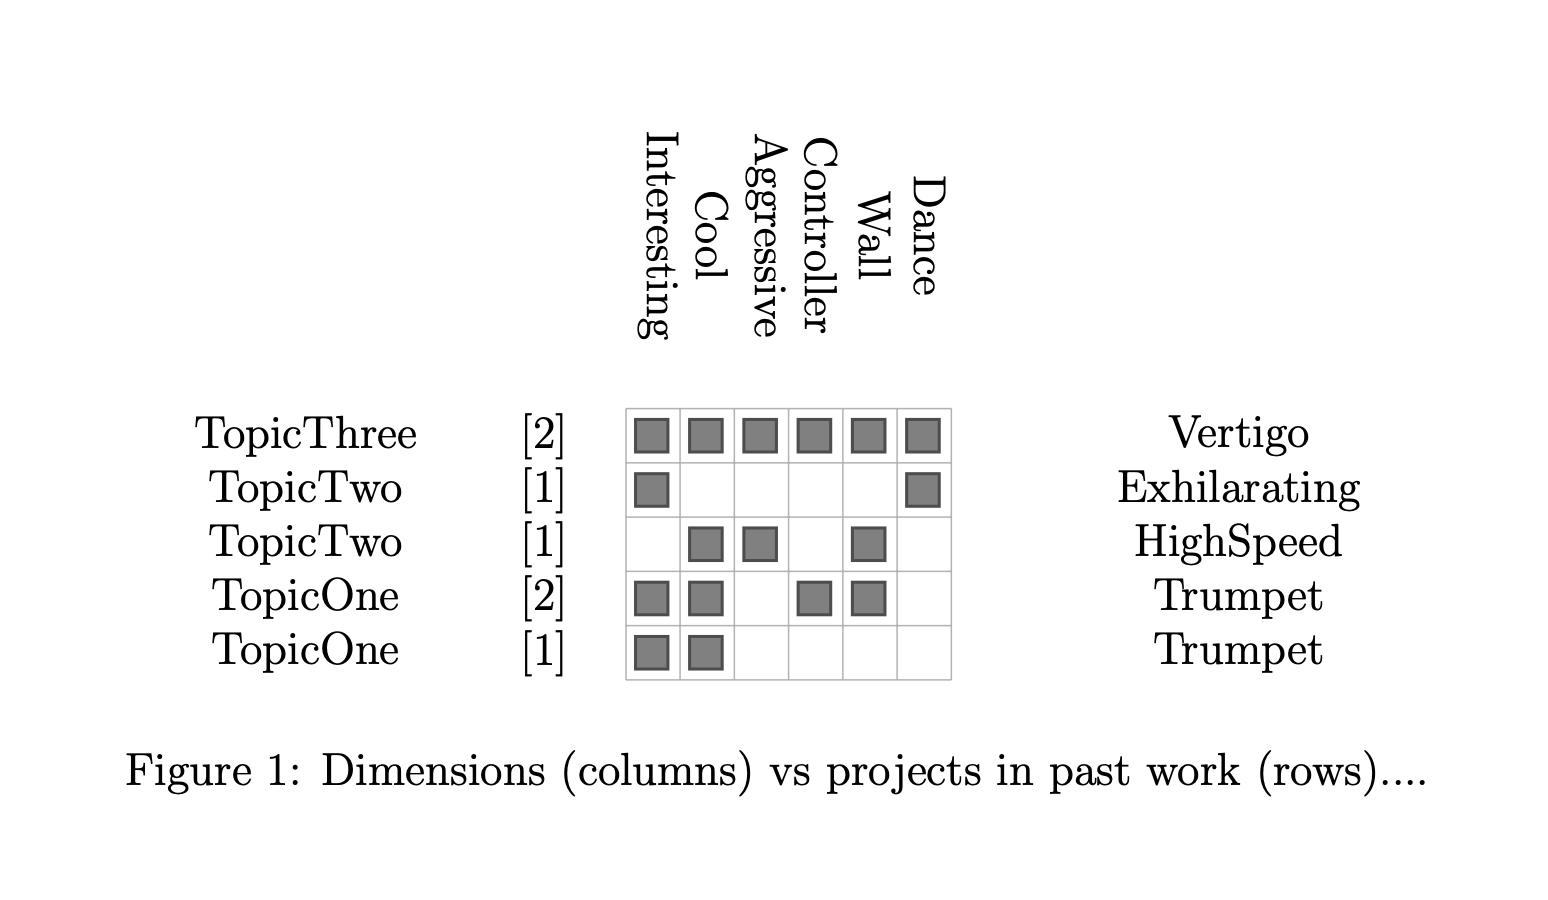
For my use case, I needed to get a bit fancier with a separate data file, a bunch of variable definitions and styles and some nested foreach loops. The program I wrote lets me specify a listing of articles (citations) with some associated features and generates a visual table displaying which article has which feature.
The code feels pretty horrible, it’s riddled with magic constants and the syntax makes it look quite offputting, but at least it does something useful. Maybe I’ll make it fancier and more robust as I learn more.
The example image I created to illustrate the concept is at the start of this post. Full example LaTeX code and the PDF that it produces can be found on GitHub: https://github.com/emllnd/data-driven-graphics-in-tikz-latex.
\begin{figure}[H]
\centering

\begin{tikzpicture}[
    gridlines/.style={
        color=black!30,
        thin
    },
    featurebox/.style={
        rectangle,
        minimum size=3mm,
        draw=black!70,
        fill=black!50,
        thick
    }
]

\input{tikz_graphic_data}

\def\gridstep{0.5}
\def\gridoffset{2.5}
\def\gridstepcm{\gridstep cm}
\def\gridoffsetcm{\gridoffset cm}

\def\gridwidth{\numfeatures*\gridstep cm}
\def\gridheight{\numpapers*\gridstep}

\draw[
    step=\gridstep,
    shift={(0.1+\gridstep*0.5,\gridstep*0.5)},
    gridlines
] (0,0) grid (\gridwidth,\gridheight);

\def\colcitation{1}
\def\coltopic{2}
\def\colfeature{3}
\def\colgenre{4}

\foreach \paper [count=\i] in \papers {
    \foreach \field [count=\col] in \paper {
        \ifx \col \coltopic
            \node at (-5.1+\gridoffset,\i*0.5) {{\field}};
        \fi

        \ifx \col \colcitation
            \node at (-2.9+\gridoffset,\i*0.5) {{\field}};
        \fi

        \ifx \col \colfeature
            \foreach \hasfeature [count=\k] in \field {
                \foreach \feature [count=\featureindex] in \featurenames {
                    \ifx \hasfeature \feature
                        \node at (\gridoffset+\featureindex*\gridstepcm,\i*\gridstep) [featurebox] {};
                    \fi
                }
            }
        \fi

        \ifx \col \colgenre
            \node at (0.5+\gridoffset+\numfeatures*\gridstep,\i*0.5) {{\field}};
        \fi
    }

}

\foreach \feature [count=\i] in \featurenames {
    \node [
        rotate=-90
    ] at (0.15+\i*0.5,1.85+\numpapers*\gridstep) {\feature};
}

\end{tikzpicture}

\caption{Dimensions (columns) vs projects in past work (rows)....}
\label{figure:designspace}

\end{figure}
After a little bit of testing I ended up with the following inline data definition, which started to look like something I can work with without getting dragged down into the weeds of updating ten different variables every few minutes.
\def\numfeatures{6} % needs to be updated manually
\def\featurenames{
    Interesting,
    Cool,
    Aggressive,
    Controller,
    Wall,
    Dance, % the last comma seems important to have
}

\def\numpapers{5} % needs to be updated manually
\def\papers{
    {
        \cite{ReferenceOne},
        TopicOne,
        {Interesting, Cool},
        Trumpet
    },
    {
        \cite{ReferenceTwo},
        TopicOne,
        {Interesting, Cool, Controller, Wall},
        Trumpet
    },
    {
        \cite{ReferenceOne},
        TopicTwo,
        {Cool, Aggressive, Wall},
        HighSpeed
    },
    {
        \cite{ReferenceOne},
        TopicTwo,
        {Interesting, Dance},
        Exhilarating
    },
    {
        \cite{ReferenceTwo},
        TopicThree,
        {Interesting, Cool, Aggressive, Controller, Wall, Dance},
        Vertigo
    }, % the last comma seems important to have
}
Looks quite a bit like JSON, doesn’t it? Hmm…
Some cursory googling did not reveal an obvious solution to take advantage of actual JSON in TikZ instead of working with this almost-JSON hackery. In the future, I might dig further to find or make something like that… But it might also be that this solves my current problem and when I’m done here I will just move on.
Even then, I believe I will have to develop the code at least a slight bit more to achieve the graphic I want. Thus, this saga is to be continued so stay tuned for a possible Part 2! *UPDATE 2021-06: Part 2 is here.*
Reminder, full example LaTeX code and the PDF that it produces can be found on GitHub: https://github.com/emllnd/data-driven-graphics-in-tikz-latex.
Thanks for reading!