

Data-driven graphics in D3.js/LaTeX
18 Jun 2021
You perhaps saw my earlier post about Data-driven graphics in TikZ/LaTeX. Since then I gave up on TikZ in favor of a more easily workable graphics system that scaled better to my needs: D3.js.
This is all related to a motion games (exergames) -themed thesis that I finished recently. It deserves its own post, which is still a work-in-progress. I aim to publish it in the upcoming weeks and will add a link here when done, stay tuned.
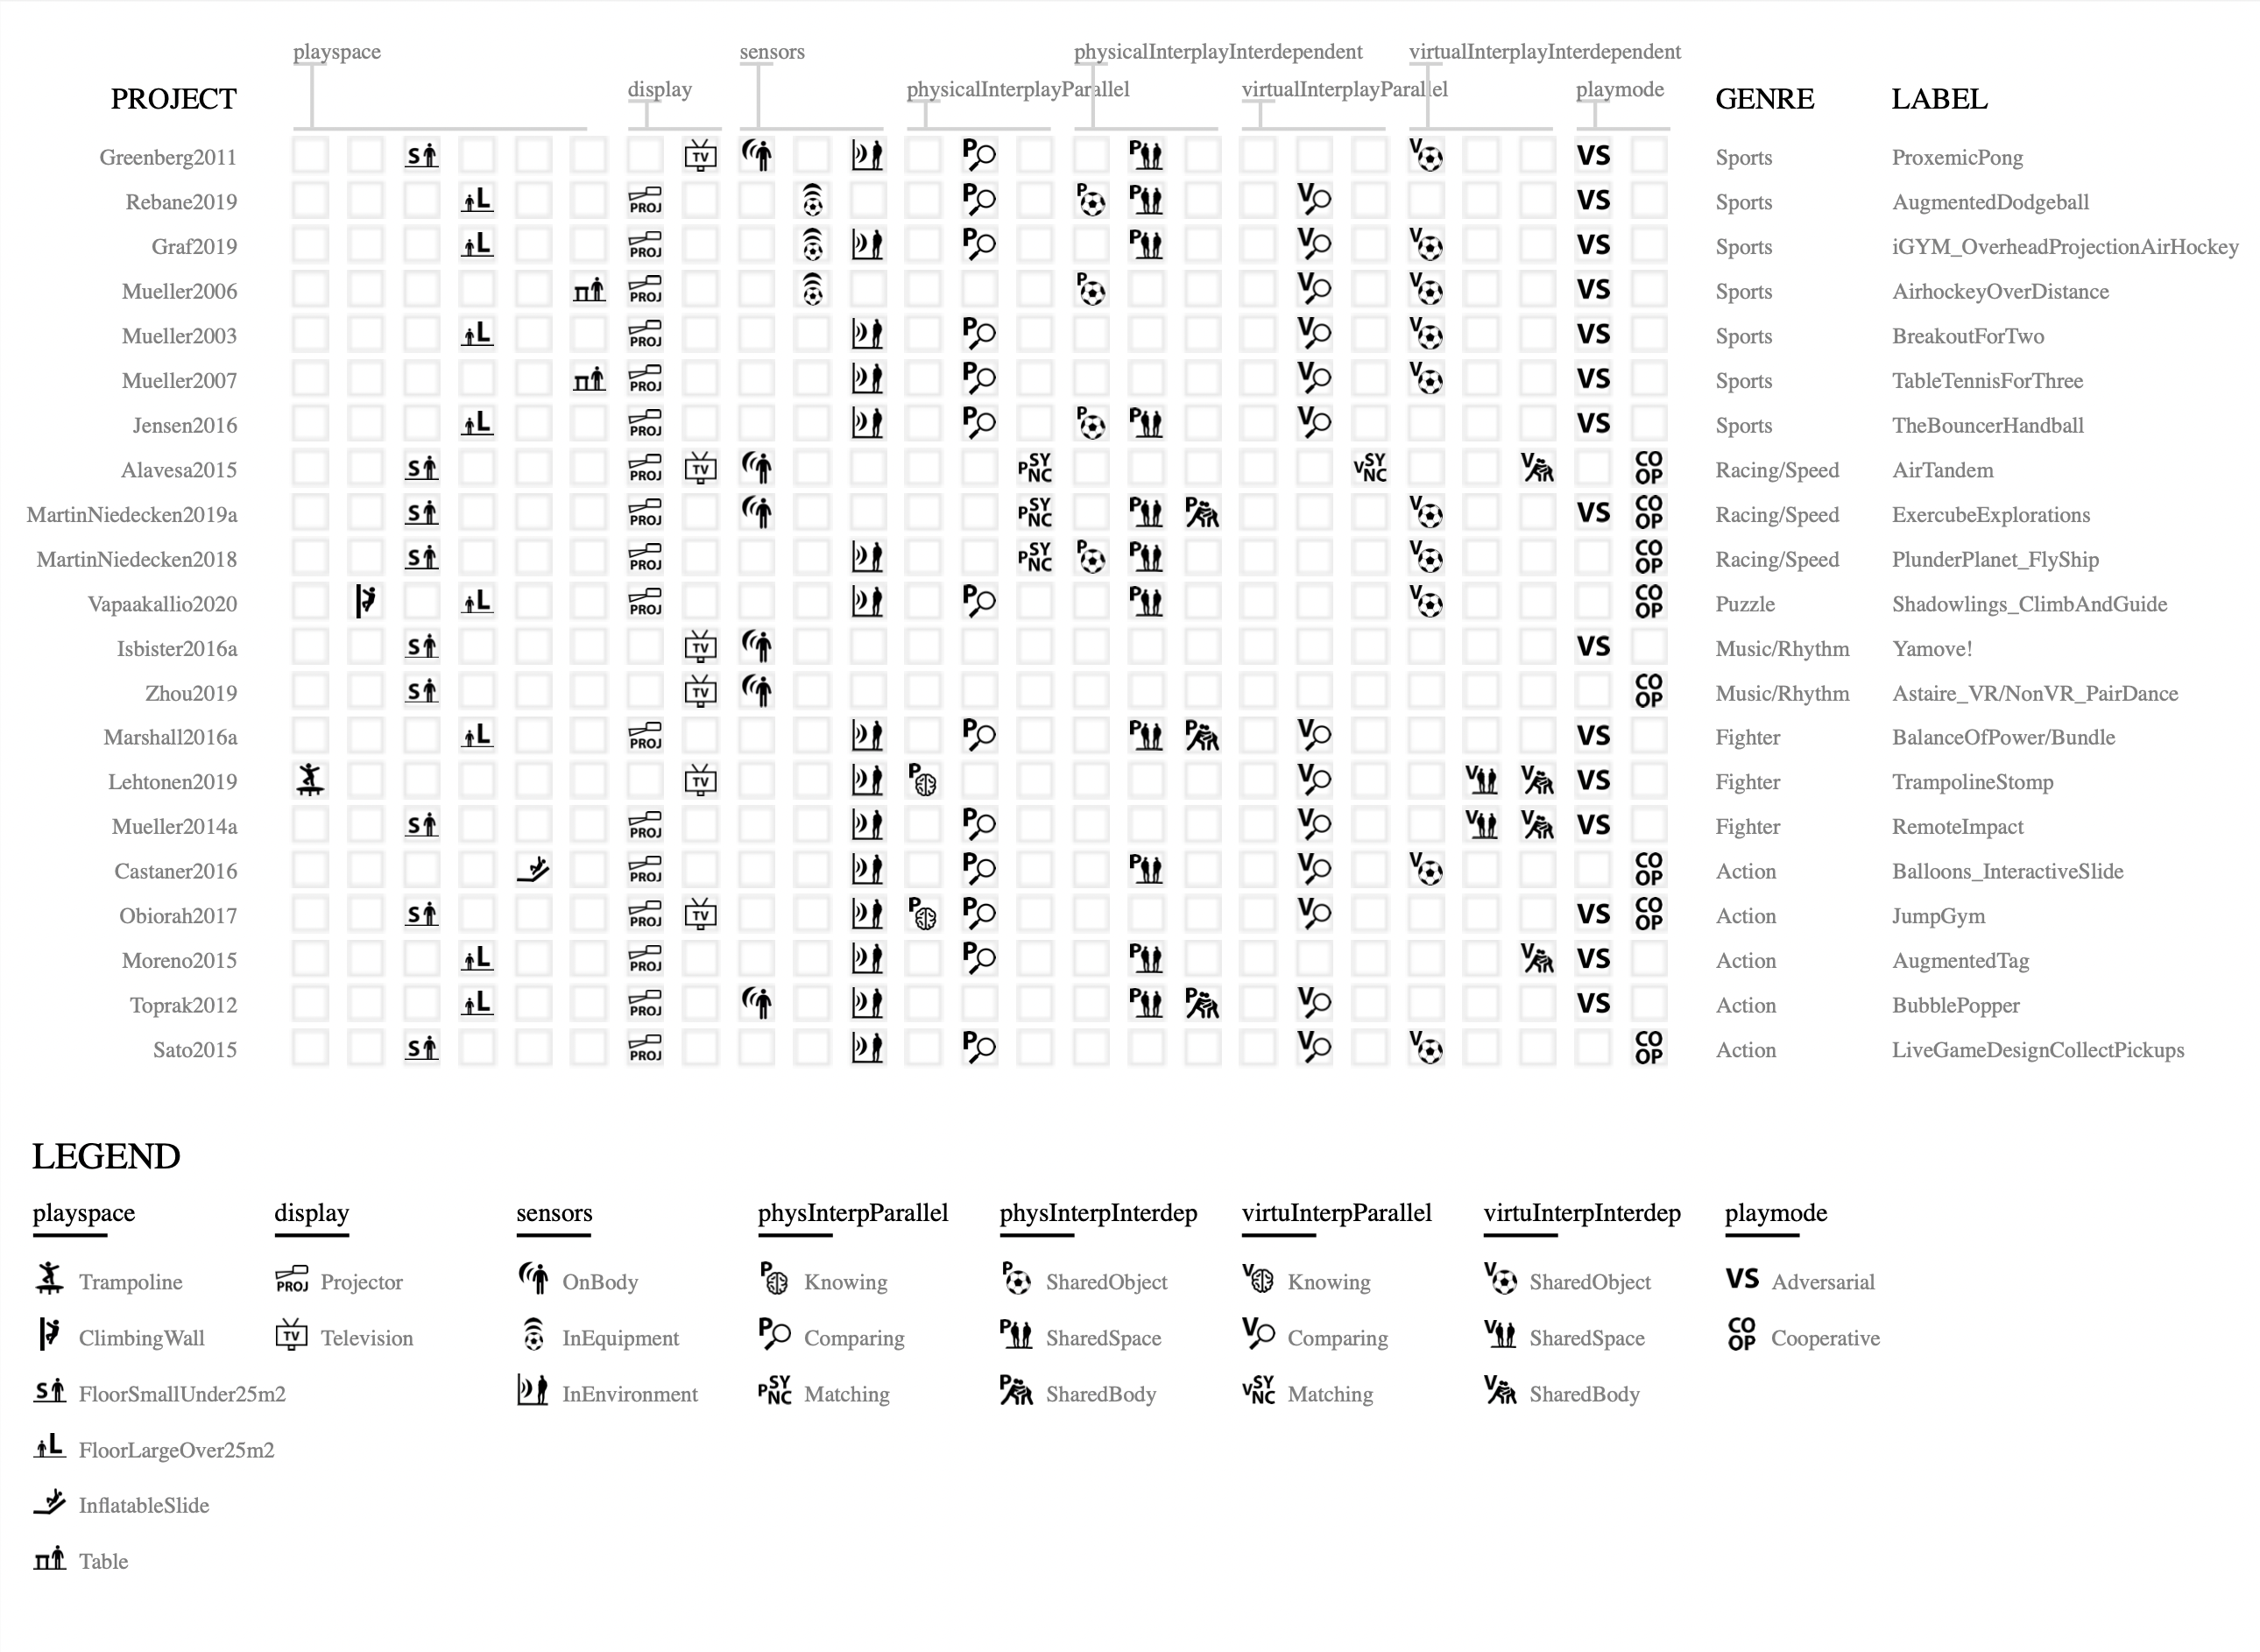
A key part of the thesis was a graphical collection of properties of previous works that enables quickly finding connections between them. To create a satisfactorily informative and intuitive graphic I used a combination of a few prominent data visualization, web development and design tools.
This post shows some of the workflows and the reasoning behind them. It is accompanied by a GitHub repository showing the full code and work files: https://github.com/emllnd/data-driven-graphics-in-d3js-latex.
One of the main benefits of D3 over TikZ is the ability to leverage custom TypeScript types for easy definition and checking of the shape of input data. As any somewhat experienced developer knows, types allow for much easier reasoning when constructing the multitude of small processing steps that are required in a slightly larger system such as the image generator here. As usual with JS/TS, wiring sync/async functions correctly caused some headscratching, but nothing major.
(async () => {
    const response = await fetch('./data_files/design_space_data.json')
    const jsonString = await response.json()

    let data = jsonString as DesignSpaceData
    data.projects = data.projects.sort( (a,b) => a.genre > b.genre ? -1 : 1 )

    data.images = await imgDatas(data)

    let svgElement = constructGraphic(data)
    createSaveSVGButton(svgElement)
})()

// ...

type DesignSpaceData = {
    dimensions: Dimension[],
    projects: ProjectInfo[],
    images: ImageDataB64[]
}

// ... and so on, full code in repo
I used hand-written JSON to input the data. It is found in the file data_files/design_space_data.json. Not very fancy, but good enough for this use case.
{
	"dimensions": [
		{
			"name": "playspace",
			"values": [
				"Trampoline",
				"ClimbingWall",
				"FloorSmallUnder25m2",
				"FloorLargeOver25m2",
				"InflatableSlide",
				"Table"
			]
		},

// ... and so on, full code in repo
In the end I gave up with the pretty(?) LaTeX fonts and clickable-link integration. Links are nice, but people reading academic work tend to be quite adept at scanning the bibliography for referenced author last names and years anyway. Losing links was not a catastrophe.
Guess I could have used Computer Modern to make the graphic blend in fontwise, but that was not a priority.
By the way, I also gave up on LaTeX as a document content format, opting to use it only as the style template for a document generated from markdown with pandoc. Will possibly write another post with more details, stay tuned.
I wanted to set up the project with a modern version of D3 (v6, which now seems to have been superseded by v7 just a few days ago), a customizable build environment using webpack, nice reproducibility with npm and version controllability with git.
Arguments can be made for and against the efficiency and intuitiveness of these tools, but they work alright for many and I can get things done with them. That suffices for a small solo project like this. The initial setup can be laborious, but I had already done most of it during a previous project so I just needed to copy-paste and adjust slightly.
A valid question to ask would be: Why not use Observable for this? It could have been much quicker.
Answer is that I’m a bit over-protective of having data local and using reliable dependencies that are unlinkely to vanish off the earth, such as git and key parts of the npm/node/js ecosystem. Perhaps I will some day count Observable among those but for now it’s still a bit too new and niche in my opinion. Looks very handy for prototyping, though!
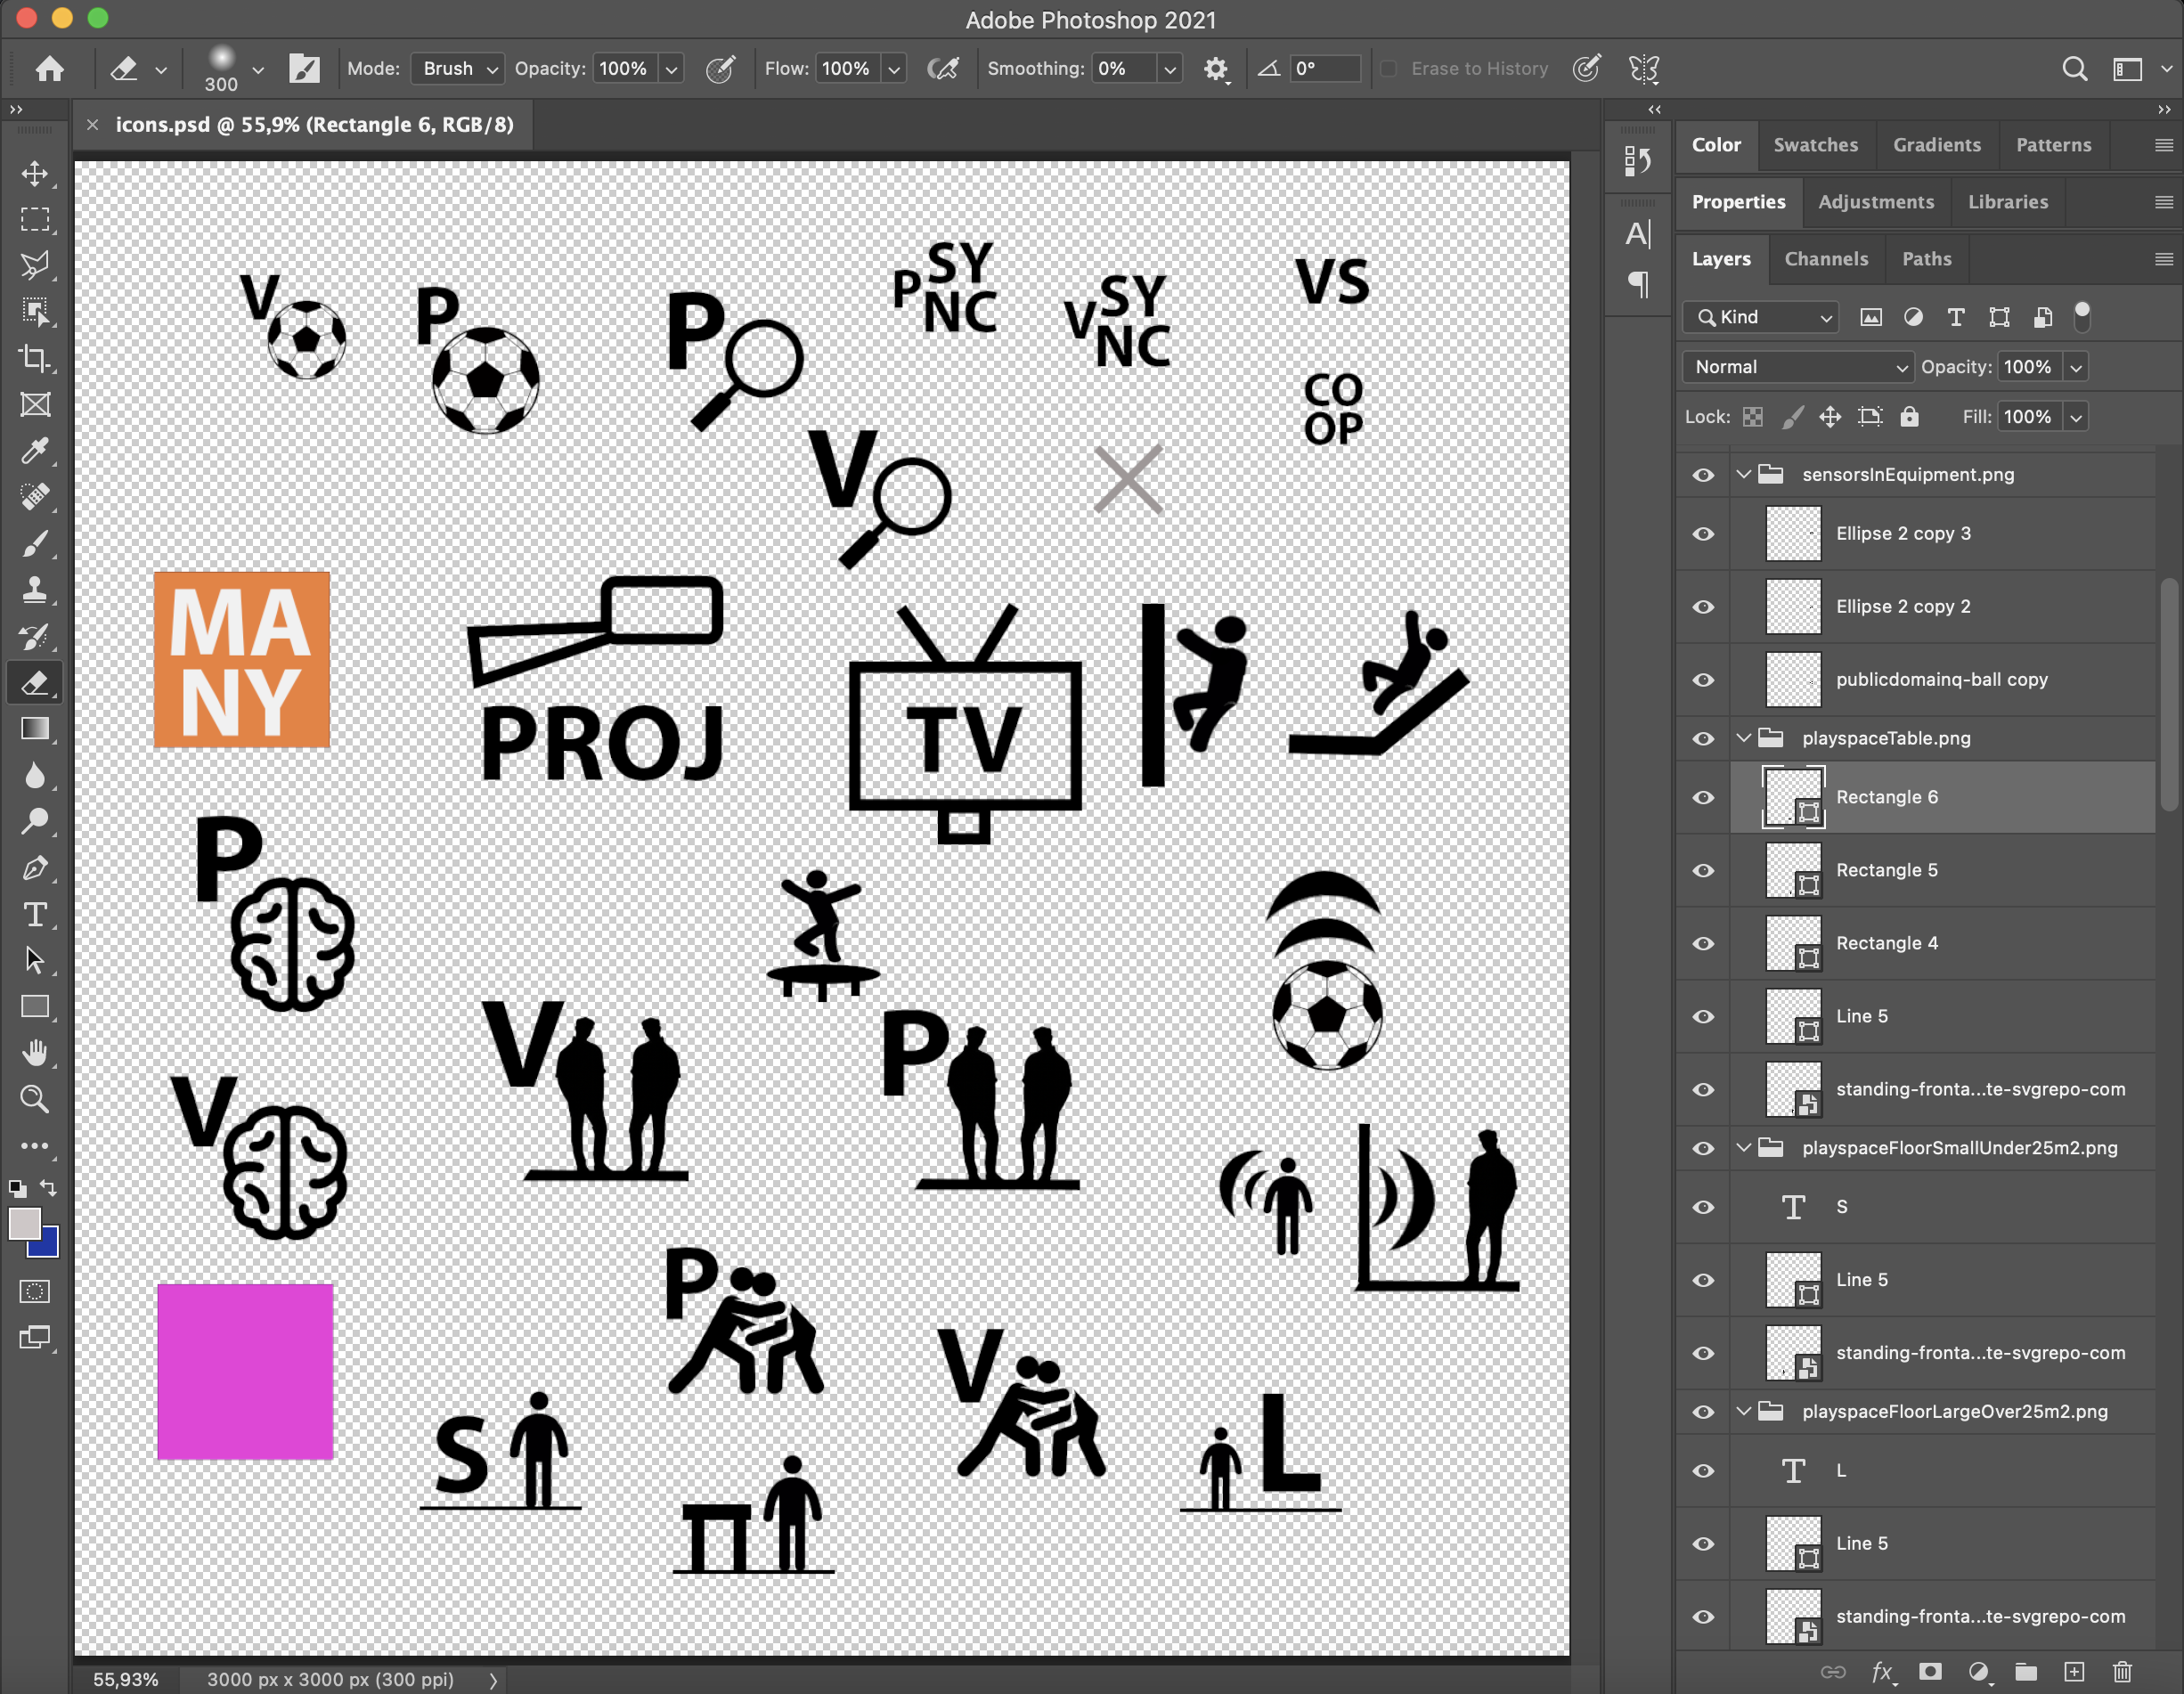
The icons were created in Photoshop, workflow being basically just a number of “.png” suffixed layer groups slapped wherever on the canvas. The Generate Image Assets functionality in PS and auto-reloading in webpack-dev-server were big enablers of quick iteration as I was able to see each adjustment in context pretty much right away.
While working on the graphic and the thesis text, I was just embedding a screenshot of the browser window in the in-progress thesis PDF during most of the process. It served its purpose, but near the end it was finally time to convert the low-res raster image to a vector graphic so that fonts and icons stay crisp when zooming.
Note that the image embedded in this blogpost is a raster version of the graphic, download the PDF from the github repo to view the final vector version.
Embedding a vector graphic in a pandoc/LaTeX doc was easiest to do via PDF. At first I tried with SVG for a while but ran into issues. Saving the D3 graphic to PDF was quickest to do using the regular old ‘Print to PDF’ function of the web browser.
During the high-res export experiments (with SVG, before PDF) I noticed that the small icons in the SVG graphic would get included as reference links pointing to PNG file paths on my machine. Instead, I needed them to be embedded in the graphic itself so that they would get correctly included in the end product. Thus, I chose to read the image data into base64-encoded strings to make the resulting graphic self-contained.
As this mini-app has no users and thus no FCP / TTI requirements besides my own patience, extra processing and blocking the main thread were not a concern. The base64 encoding was unnecessary in the end (due to PDF) but it was good coding practice nonetheless. I had other things to improve so I didn’t bother taking it out. Perhaps the example code will be valuable for someone.
// dimval stands for "dimension value", pair of a dimension
// and one possible value for that design dimension
// e.g. displayProjector is the value "Projector"
// for the design dimension "display"
//
// perhaps naming could be improved, but this was enough
// for me to keep track of the moving parts when working

// see example repo for full code

// base64-encoded icon image
const b64img = (dimval: string, data: DesignSpaceData) => {
    const imgDataB64 = data.images.find(img => img.name === dimval)
    return imgDataB64.data
}

// ...

// loads PNG (or other) images and stores them as base64 data strings
const imgDatas = async (data: DesignSpaceData): Promise<ImageDataB64[]> => {
    let imgDatas: ImageDataB64[] = []
    for (const dim of data.dimensions) {
        for (const val of dim.values) {
            const imgData = await imgDataFromDimval(dim.name + val, data)
            imgDatas.push(imgData)
        }
    }
    return imgDatas
}

// ...

const imgDataFromDimval = async (dimval: string, data: DesignSpaceData) => {
    const imgPath: string = getImagePathFromDimval(dimval, data)
    const response = await fetch(imgPath)
    const blob = await response.blob()
    const blobData = await dataFromBlob(blob)

    const imgDataB64: ImageDataB64 = {
        name: dimval,
        data: blobData
    }

    return imgDataB64
}

// ...

type ImageDataB64 = {
    name: string,
    data: string
}

// ...

dim.values.forEach(function(val) {
    // ...

    svg.append("svg:image")
        .attr('width', gridSizeLarge)
        .attr('height', gridSizeLarge)
        .attr("x", legendLeftOffset + 130 * dimIdx)
        .attr("y", legendTopOffset + 50 + 30 * valIdx)
        .attr("href", b64img(dim.name + val, data))

    //...
})
That’s it! I hope I could shed some light on what goes into making an informational graphic like this. This post and the repository hopefully serve as a resource and a source of inspiration. If something seems unclear you can send questions to me, see About page for contact details. If you would like to hire me to do something similar for you or your company, please reach out!
Reminder, full code and Photoshop work file are on GitHub: https://github.com/emllnd/data-driven-graphics-in-d3js-latex.
Thanks for reading!